Parabolic SAR
The Parabolic SAR (Stop and Reverse) is a popular technical indicator used in financial markets to identify potential trend reversals. Developed by J. Welles Wilder Jr., it utilizes a series of dots plotted on a price chart to highlight potential entry and exit points.
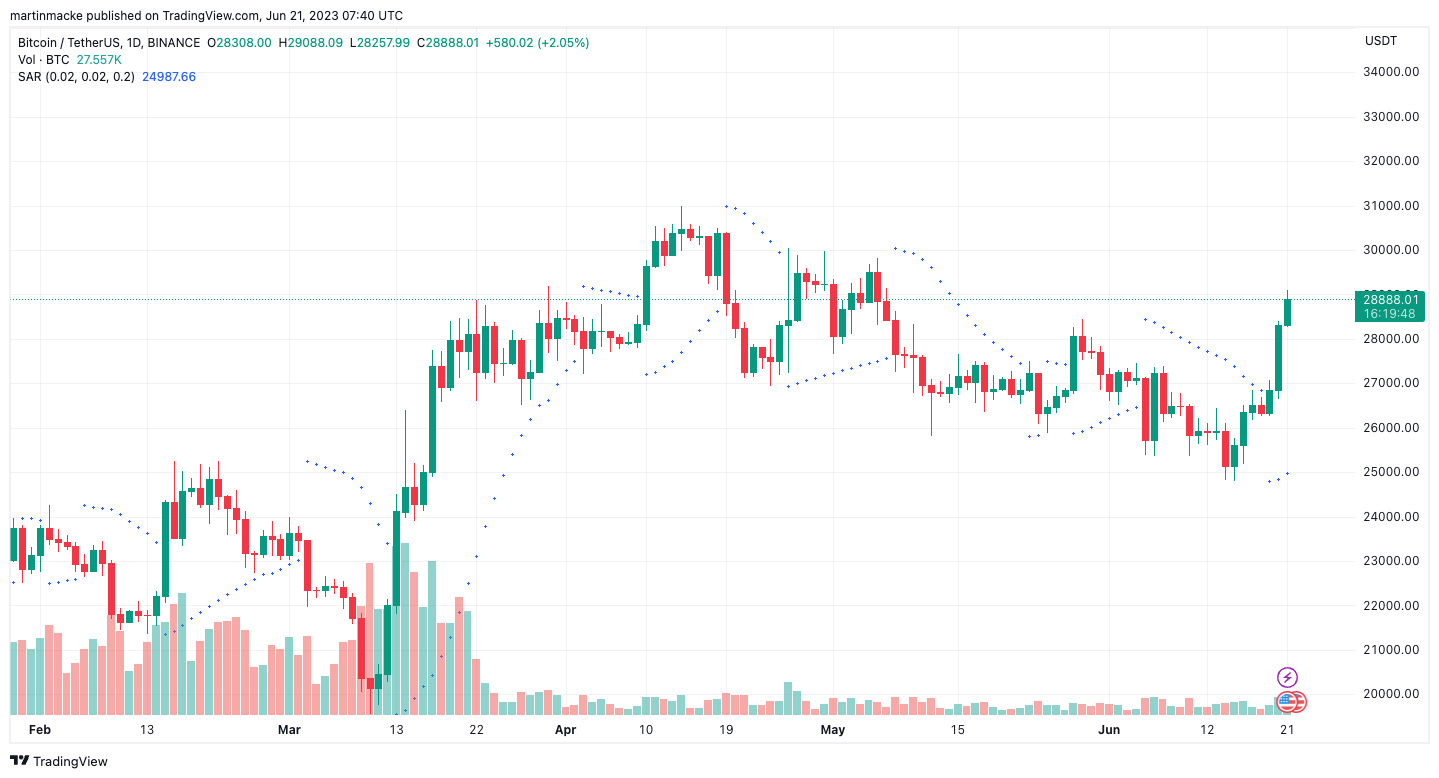
The Parabolic SAR dots are positioned above or below the price, depending on the direction of the prevailing trend. When the dots are below the price, it indicates an uptrend, while dots above the price indicate a downtrend. The dots gradually adjust their position as the price evolves, creating a parabolic shape. Traders often use the Parabolic SAR as a tool for setting stop-loss orders and trailing stops, as it dynamically adapts to market conditions and can help identify potential trend reversals in a timely manner.
In the Parabolic SAR formula, users have the flexibility to adjust three optional parameters: start, increment and maximum. The start parameter determines the initial acceleration factor for the indicator. The increment parameter specifies the rate at which the acceleration factor increases over time. Lastly, the maximum parameter sets the upper limit for the acceleration factor. By modifying these parameters, traders can customize the sensitivity and responsiveness of the Parabolic SAR indicator to suit their trading strategies and market conditions.
Get started with the psar
Simply make an HTTPS [GET] request or call in your browser:
[GET] https://api.taapi.io/psar?secret=MY_SECRET&exchange=binance&symbol=BTC/USDT&interval=1h
API response
The psar endpoint returns a JSON response like this:
			{
  "value": 38091.00023984
}
Example response from TAAPI.IO when querying psar endpoint.
API parameters
binance, binancefutures or one of our supported exchanges. For other crypto / stock exchanges, please refer to our Client or Manual integration methods.
BTC/USDT Bitcoin to Tether, or LTC/BTC Litecoin to Bitcoin...
1m, 5m, 15m, 30m, 1h, 2h, 4h, 12h, 1d, 1w. So if you're interested in values on hourly candles, use interval=1h, for daily values use interval=1d, etc.
backtrack parameter removes candles from the data set and calculates the psar value X amount of candles back. So, if you are fetching the psar on the hourly and you want to know what the psar was 5 hours ago, set backtrack=5. The default is 0.
chart parameter accepts one of two values: candles or heikinashi. candles is the default, but if you set this to heikinashi, the indicator values will be calculated using Heikin Ashi candles. Note: Pro & Expert Plans only.
true or false. Defaults to false. By setting to true the API will return a timestamp with every result (real-time and backtracked) to which candle the value corresponds. This is especially helpful when requesting a series of historical values using the results parameter.
1685577600
1731456000 If you only use fromTimestamp, the API will return all results from that time until present.
true or false. Defaults to true. By setting to false, the API will ensure that there are no candles missing. This often happens on lower timeframes in thin markets. Gaps will be filled by a new candle with 0 volume, and OHLC set the the close price of the latest candle with volume.
number or max. Use this parameter to access historical values on the past X candles until the most recent candle. Use max to return all available historical values. Returns an array with the oldest value on top and most recent value returned the last.
Determines the initial acceleration factor for the indicator.
Default: 0.02
Specifies the rate at which the acceleration factor increases over time.
Default: 0.02
Sets the upper limit for the acceleration factor.
Default: 0.2
More examples
Let's say you want to know the psar value on the last closed candle on the 30m timeframe. You are not interest in the real-time value, so you use the backtrack=1 optional parameter to go back 1 candle in history to the last closed candle.
[GET] https://api.taapi.io/psar?secret=MY_SECRET&exchange=binance&symbol=BTC/USDT&interval=30m&backtrack=1
Get psar values on each of the past X candles in one call
Let's say you want to know what the psar daily value was each day for the previous 10 days. You can get this returned by our API easily and efficiently in one call using the results=10 parameter:
[GET] https://api.taapi.io/psar?secret=MY_SECRET&exchange=binance&symbol=BTC/USDT&interval=1d&results=10
Looking for even more integration examples in different languages like NodeJS, PHP, Python, Curl or Ruby? Continue to [GET] REST - Direct documentation.