Volume
The Volume Indicator returns the total trading volume for the specified time interval, offering insights into market activity and liquidity.
You can also get the volume using our candle endpoint, where the API returns it alongside the other OHLCV (Open, High, Low, Close, and Volume) values.
How to Interpret the Volume Results:
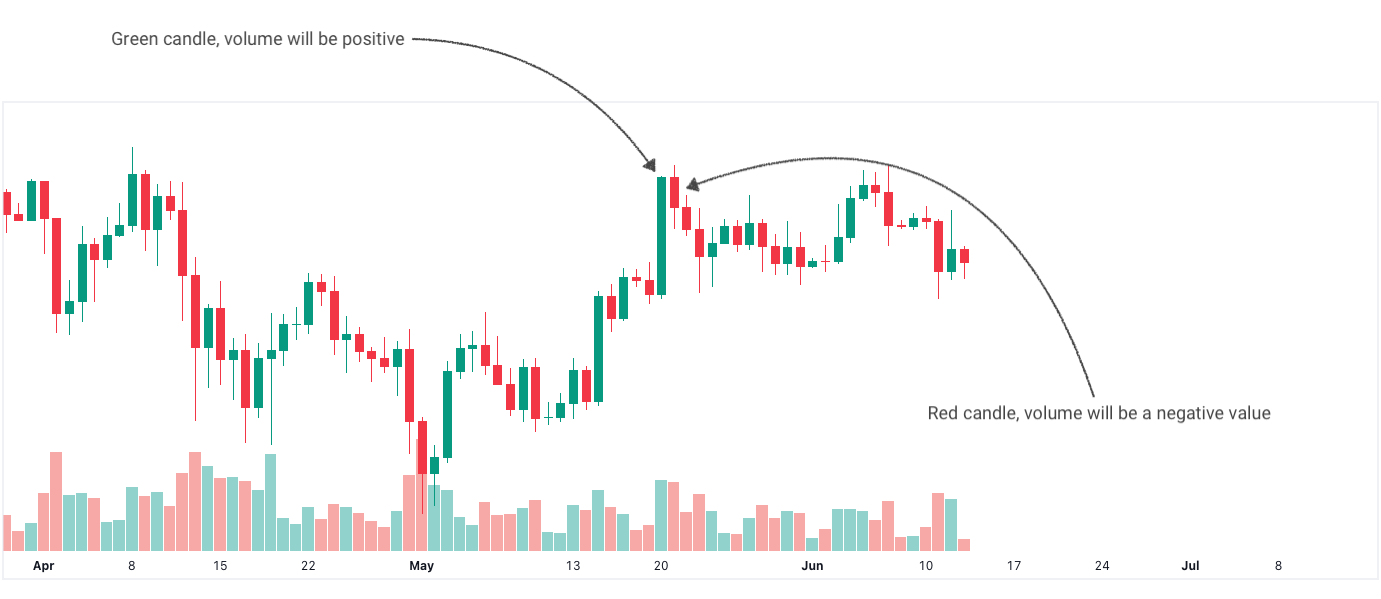
Positive Values: A positive value indicates the total volume for the interval where the closing price is higher than the opening price, signifying a green candle. This suggests buying pressure in the market.
Negative Values: A negative value indicates the total volume for the interval where the closing price is lower than the opening price, signifying a red candle. This suggests selling pressure in the market.
We provide fast and easy to use API access to the Volume for all of the most popular assets like stocks, crypto (try one of the popular exchanges like Binance) and forex, on all commonly used timeframes – from the weekly and daily all the way down to one minute intervals.
Get started with the volume
Simply make an HTTPS [GET] request or call in your browser:
[GET] https://api.taapi.io/volume?secret=MY_SECRET&exchange=binance&symbol=BTC/USDT&interval=1h
API response
The volume endpoint returns a JSON response like this:
					{
	"value": 37175.32356
}

// OR

{
	"value": -7754.654559997343 // Negative value indicates a red candle
}
Example response from TAAPI.IO when querying volume endpoint.
API parameters
binance,
binancefutures or one of our supported exchanges. For other crypto / stock
exchanges, please refer to our Client
or Manual integration methods.
BTC/USDT Bitcoin to Tether, or
LTC/BTC Litecoin to Bitcoin...
1m,
5m, 15m, 30m, 1h, 2h,
4h, 12h, 1d, 1w. So if you're
interested in values on hourly candles, use interval=1h, for daily values
use interval=1d, etc.
backtrack parameter removes candles from the data set and calculates
the volume value X amount of candles back. So, if you are fetching the
volume on the hourly and you want to know what the
volume was 5 hours ago, set backtrack=5. The default is
0.
chart parameter accepts one of two values: candles or
heikinashi. candles is the default, but if you set this to
heikinashi, the indicator values will be calculated using Heikin Ashi
candles. Note: Pro & Expert Plans only.
true or false. Defaults to false. By setting to
true the API will return a timestamp with every result (real-time and
backtracked) to which candle the value corresponds. This is especially helpful when
requesting a series of historical values using the results parameter.
1685577600
1731456000 If
you only use fromTimestamp, the API will return all results from that time until
present.
number or max. Use this parameter to access historical
values on the past X candles until the most recent candle. Use max
to return all available historical values. Returns an array with the oldest value on top
and most recent value returned the last.
More examples
Let's say you want to know the volume value on the last closed
candle on the 30m timeframe. You are not interest in the real-time value, so you
use the backtrack=1 optional parameter to go back 1 candle in history to the last
closed candle.
[GET] https://api.taapi.io/volume?secret=MY_SECRET&exchange=binance&symbol=BTC/USDT&interval=30m&backtrack=1
Get volume values on each of the past X candles in one call
Let's say you want to know what the volume daily value was each
day for the previous 10 days. You can get this returned by our API easily and efficiently in one
call using the results=10 parameter:
[GET] https://api.taapi.io/volume?secret=MY_SECRET&exchange=binance&symbol=BTC/USDT&interval=1d&results=10
Looking for even more integration examples in different languages like NodeJS, PHP, Python, Curl or Ruby? Continue to [GET] REST - Direct documentation.