Moodix
The Moodix sentiment index is an indicator of how financial markets react to the constant influx of news (headlines). From our long-term research (since 2017), it appears that the vast majority of major market reactions, i.e., price changes, in the case of Moodix futures ES, which most major European and American markets strongly correlate with, are the result of randomly emerging news.
Market makers, hedge funds, and other large traders operating on Bid/Ask must respond to news from the world’s largest news agencies (Bloomberg, Financial Times, Reuters, Wall Street Journal, etc.) and adjust their probability models of further development.
The resulting market reaction is de facto a consensus of these major players on each price-forming news. This is very important for ordinary traders, as we can estimate how they will react in the following hours and days to the next incoming news. We know what “average” mood these players are in.
The measurement itself takes place on ES futures contracts because it is the largest and most liquid market, which is open 23 hours a day. This makes immediate reactions to news easily recognizable and measurable.
For your idea: on average, 4000-5000 news items flow into the financial markets every day, with only about 20-30 of them actually price-forming (affecting further development).
This is where Moodix helps you. It sorts these news for you, identifies the important ones, and expresses in a chart during the day whether the market reactions are positive or negative in total.
The measurement starts every trading day from zero. Most (about 80%) price-forming news is measured within ten minutes of its publication, some with a delay of several hours (e.g., Asian stock market session).
Moodix sentiment wave
The sum of the daily measurement values determines the daily value of Moodix sentiment (“news” – today’s measured value), it changes during the day with the number of measured news (“number_news” – number of measured news per day). Its value is only indicative for trading and expresses whether the price-forming news of the given trading day was predominantly positive (positive value) or negative (negative value) for the markets. For this reason, it is not recommended to orientate purely according to this information.
For orientation in moodix sentiment index, the difference of moving averages (MA10 and MA5) of this measurement is used. Why exactly MA5 and MA10? From our long-term measurement, it follows that there exists some kind of “market memory” is 1 and 2 trading weeks. That’s why we apply these averages to our measured index. The market absorbs the impact of measured news in the vast majority of cases just during these two weeks.
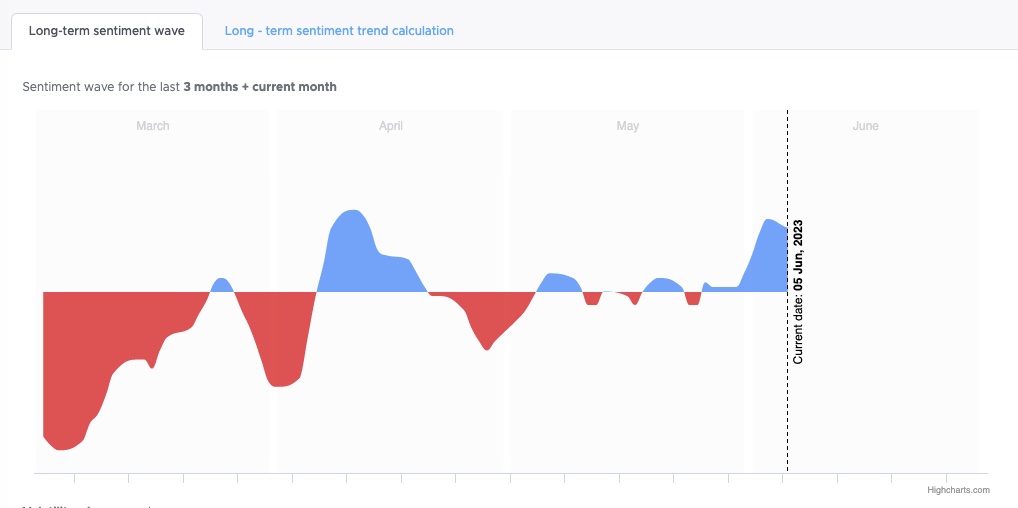
Long-term sentiment (“moodix_wave_size“) is then the difference between these two averages, and the result is a chart of sentiment value:
How to read sentiment and use it in trading?
The value of Moodix sentiment (“moodix_wave_size“) oscillates as the difference of moving averages around zero. Thanks to this, Moodix draws waves, according to which you can immediately orient yourself.
In case the market is in positive territory (so-called RiskOn), classic long strategies can be applied.
In case the market is in the opposite state – negative (so-called RiskOff), we apply short strategies.
As can be seen from the picture below, waves (sentiment) tend to alternate irregularly, they are of different lengths, from several days to several months, see examples above.
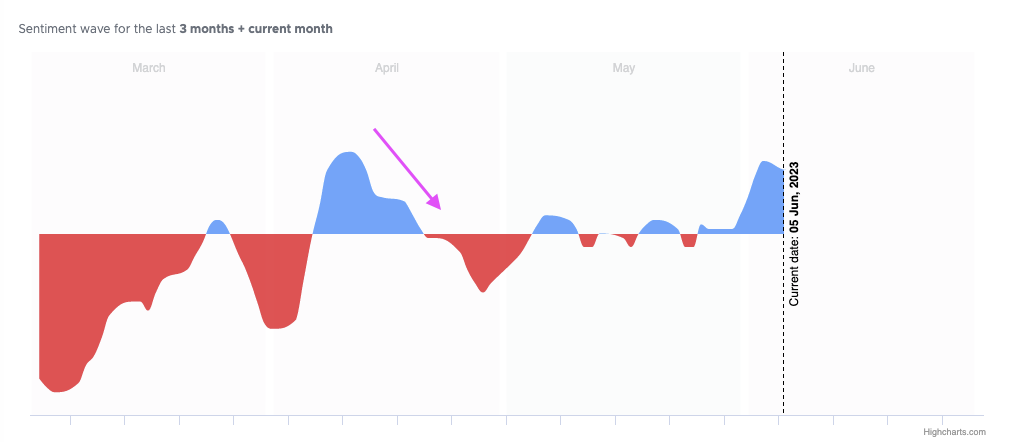
How long a wave lasts is determined by how the market continues to react to incoming news. If RiskOn and the market continues to perceive incoming news positively (regardless of what we think), RiskOn wave lasts and grows. The moment the market starts to perceive incoming news negatively, the existing RiskOn wave begins to weaken (the wave value begins to fall, see the picture from the end of the April RiskOn wave). The same logic can, of course, be applied during RiskOff waves.
To help you identify the ends of RiskOn and RiskOff waves, we provide you with information about the trend and its strength. Since Moodix measurement is very systematic, we can, considering the mentioned market memory (a week or two), identify subtle changes in market reactions to incoming news.
In our indicator, we therefore have information about the disruption of the current trend (“risk” = trend).
The trend field (“risk”) has several phases (degrees):
For RiskOn waves
Strong RiskOn = uninterrupted, continuing trend, the current value of the Moodix index is moving above both moving averages (MA5 and MA10), simply put, news that the market perceives positively still prevails.
Poor RiskOn = disrupted trend, Moodix index is moving between moving averages, below MA5 and above MA10, the market perceives current news more negatively than in the previous five days.
Fading RiskOn = indicates the ending RiskOn wave, Moodix index is below both moving averages MA5 and MA10, current measured news is worse than the average for the last two weeks.
Example of specific situation or RiskOn wave:
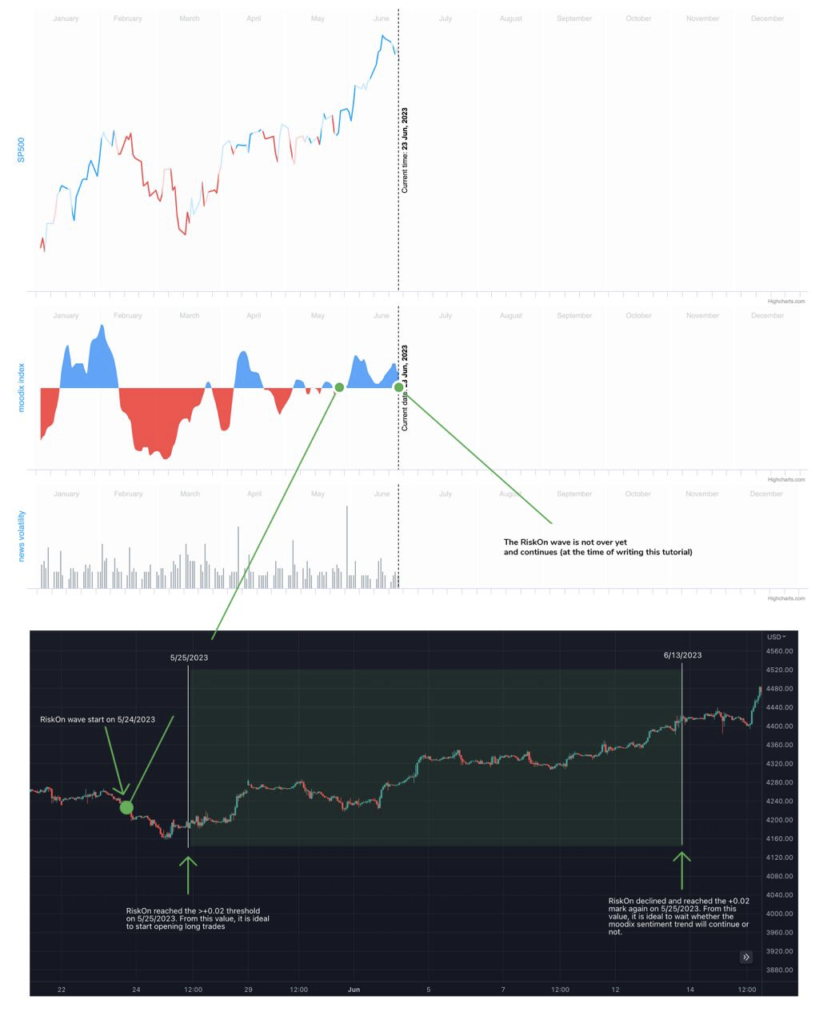
Next example show the practical use of moodix index. Once the „moodix_wave_size“ reading is more than (or at least) +0,02, it can be taken as a confirmation of a RiskOn wave. We recommend waiting till that threshold until employing some of common long strategies. From our observation it can be stated that beyond this threshold the market tends to be more greedy and the overall sentiment remain in long territory for a while.
Vice versa, while trading on a RiskOn wave, we recommend closely watch the reading of „moodix_wave_size“ value. Once it starts to decline to the +0,02 threshold or below it, it signals vanishing of RiskOn wave and then it is recommended to stay focused on closing long trades soon and not opening any new ones. See an example of current (at the time of creating the description) RiskOn wave that lasted from 5/25/2023 till 6/13/2023 and then started to decline.
For RiskOff waves
Strong RiskOff = uninterrupted, continuing negative trend, the current value of the Moodix index is moving below both moving averages (MA5 and MA10), simply put, news that the market perceives negatively still prevails.
Poor RiskOff = disrupted negative trend, Moodix index value is moving between moving averages, above MA5 and below MA10, the market perceives current news more positively than in the previous five days.
Fading RiskOff = indication of ending RiskOff wave, Moodix index value is above both moving averages MA5 and MA10, current measured news is better than the average of the past two weeks.
Example of specific situation for RiskOff wave:
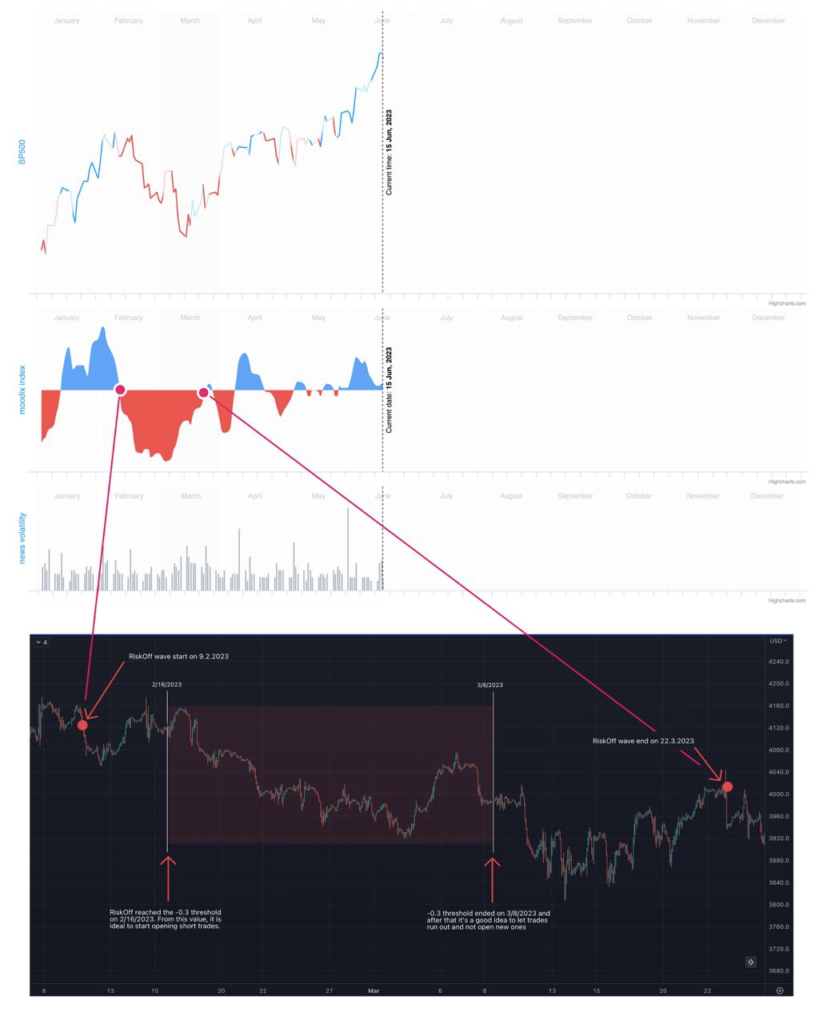
Generally speaking, there needs to be a solid, strong signal for clear recommendation for short trades in moodix_wave_size than for long trades, we suggest to watch the threshold of -0,3. The reason is that markets in general have an inherent tendency to rise, then they have to fall.
See an example of risk of wave with previously mentioned thresholds (-0,3) below:
Non-trending period
No State – indicates an unclear state of market sentiment, it can be understood as a recommendation to wait with trading. These situations occur during a long-term sideways trend. Currently, news does not deviate from the average of unmeasured news for one and two weeks (MA5 and MA10). Although these situations are relatively rare, in periods when markets are waiting for more significant news that could change sentiment so that a new, more clear trend could start. We recommend not trading during these periods.
As two previously mentioned examples imply, such a state occurs when „moodix_wave_size“ value oscillates between two thresholds (-0,3 ; +0,02). Then the state of the market is situated in such a Non-trending period. Then it is recommended to stand by and wait till „moodix_wave_size“ break either of those thresholds to start trading.
Get started with the moodix
Simply make an HTTPS [GET] request or call in your browser:
[GET] https://api.taapi.io/moodix?secret=MY_SECRET&exchange=binance&symbol=BTC/USDT&interval=1h&type=moodix
API response
The moodix endpoint returns a JSON response like this:
			{
	"time": "2023-05-24T05:25:15.396944-07:00",
	"moodix_wave": "RiskOff",
	"risk": "Strong RiskOff",
	"news": -0.04,
	"number_news": 5,
	"week_moodix": -0.3,
	"market_open": "1",
	"moodix_wave_size": -0.05
}
Example response from TAAPI.IO when querying moodix endpoint.
API parameters
binance, binancefutures or one of our supported exchanges. For other crypto / stock exchanges, please refer to our Client or Manual integration methods.
BTC/USDT Bitcoin to Tether, or LTC/BTC Litecoin to Bitcoin...
1m, 5m, 15m, 30m, 1h, 2h, 4h, 12h, 1d, 1w. So if you're interested in values on hourly candles, use interval=1h, for daily values use interval=1d, etc.
backtrack parameter removes candles from the data set and calculates the moodix value X amount of candles back. So, if you are fetching the moodix on the hourly and you want to know what the moodix was 5 hours ago, set backtrack=5. The default is 0.
chart parameter accepts one of two values: candles or heikinashi. candles is the default, but if you set this to heikinashi, the indicator values will be calculated using Heikin Ashi candles. Note: Pro & Expert Plans only.
true or false. Defaults to false. By setting to true the API will return a timestamp with every result (real-time and backtracked) to which candle the value corresponds. This is especially helpful when requesting a series of historical values using the results parameter.
true or false. Defaults to true. By setting to false, the API will ensure that there are no candles missing. This often happens on lower timeframes in thin markets. Gaps will be filled by a new candle with 0 volume, and OHLC set the the close price of the latest candle with volume.
number or max. Use this parameter to access historical values on the past X candles until the most recent candle. Use max to return all available historical values. Returns an array with the oldest value on top and most recent value returned the last.
More examples
Let's say you want to know the moodix value on the last closed candle on the 30m timeframe. You are not interest in the real-time value, so you use the backtrack=1 optional parameter to go back 1 candle in history to the last closed candle.
[GET] https://api.taapi.io/moodix?secret=MY_SECRET&exchange=binance&symbol=BTC/USDT&interval=30m&type=moodix&backtrack=1
Get moodix values on each of the past X candles in one call
Let's say you want to know what the moodix daily value was each day for the previous 10 days. You can get this returned by our API easily and efficiently in one call using the results=10 parameter:
[GET] https://api.taapi.io/moodix?secret=MY_SECRET&exchange=binance&symbol=BTC/USDT&interval=1d&type=moodix&results=10
Looking for even more integration examples in different languages like NodeJS, PHP, Python, Curl or Ruby? Continue to [GET] REST - Direct documentation.