Relative Strength Index (RSI)
The Relative Strength Index (RSI) is a popular technical indicator used in financial markets to assess the momentum and strength of a price trend. We provide the best RSI API available.
Developed by J. Welles Wilder, the RSI is a momentum oscillator that measures the speed and change of price movements. It is typically applied to a price chart, oscillating between 0 and 100, with readings above 70 considered overbought and readings below 30 indicating oversold conditions. The Relative Strength Index is calculated based on the average gains and losses over a specified period, commonly 14 days. Traders and analysts use this indicator to identify potential trend reversals, overbought or oversold conditions, and to generate signals for buying or selling assets.
Get RSI values via API
We provide API access the RSI values for all of the most popular assets like stocks, crypto (try one of the popular exchanges like Binance) and forex, on all commonly used timeframes – from the weekly and daily all the way down to one minute intervals. You can also calculate the values on your own data using our manual method.
Customise RSI Sensitivity
When using the RSI technical indicator, you have the ability to fine-tune its responsiveness by adjusting the optional period parameter through the API. This parameter allows you to customize the number of candles considered in the RSI calculation. If you opt for a shorter period, the RSI becomes more sensitive, responding quickly to recent price changes and potentially signaling overbought or oversold conditions sooner. On the other hand, choosing a longer period smoothens the RSI’s output, offering a broader perspective on market trends. This feature lets you tailor the RSI to fit your specific trading strategies and timeframes, enhancing its effectiveness in various market conditions.
Get started for Free
The best way to access RSI is with our Pro and Expert plans.
Test drive TAAPI.IO risk-free with our 7-day free trial on all paid plans! We’re confident you’ll be hooked for the long haul!
-
Sale!

Pro
From: €14.99 / month with a 7-day free trialMost popular
Select options This product has multiple variants. The options may be chosen on the product page- All indicators
- 150.000 calls / day
- US Stocks – real-time and historical
- Indexes (SPY, QQQ, DJIA)
- Crypto data real-time and historical
- 3 symbols per API request
- Historical data 300 candles back using results
- Priority support
7-day Free Trial
-
Sale!

Expert
From: €29.99 / month
Select options This product has multiple variants. The options may be chosen on the product page- All indicators
- 400.000 calls / day
- US Stocks – real-time and historical
- Indexes (SPY, QQQ, DJIA)
- Crypto data real-time and historical
- 10 symbols per API request
- Historical data 2000 candles back using results
- Priority support
Get started with the rsi
Simply make an HTTPS [GET] request or call in your browser:
[GET] https://api.taapi.io/rsi?secret=MY_SECRET&exchange=binance&symbol=BTC/USDT&interval=1h
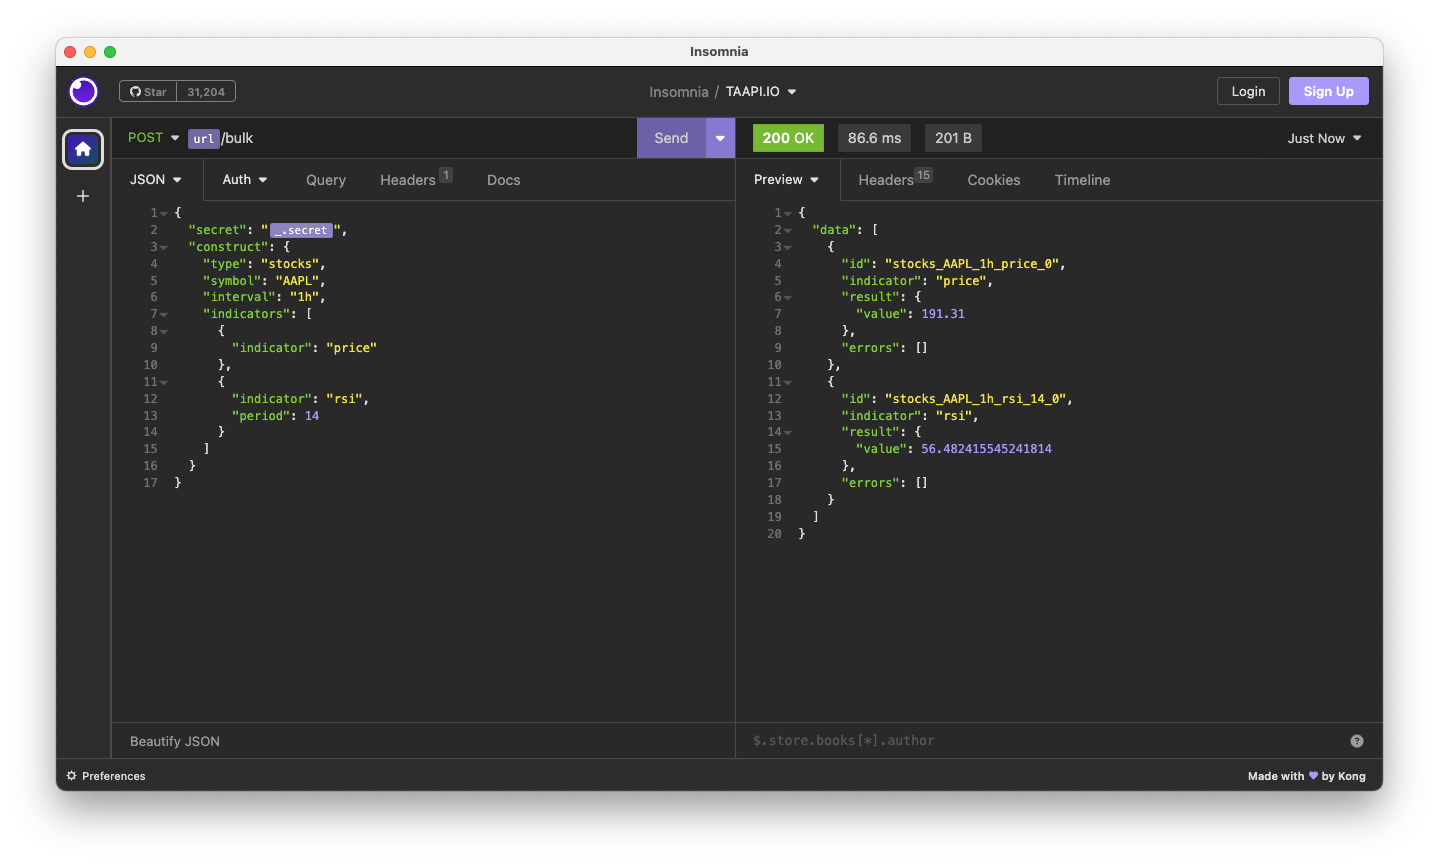
API response
The rsi endpoint returns a JSON response like this:
					{
  "value": 65.73211579249397
}
Example response from TAAPI.IO when querying rsi endpoint.
API parameters
binance,
binancefutures or one of our supported exchanges. For other crypto / stock
exchanges, please refer to our Client
or Manual integration methods.
BTC/USDT Bitcoin to Tether, or
LTC/BTC Litecoin to Bitcoin...
1m,
5m, 15m, 30m, 1h, 2h,
4h, 12h, 1d, 1w. So if you're
interested in values on hourly candles, use interval=1h, for daily values
use interval=1d, etc.
backtrack parameter removes candles from the data set and calculates
the rsi value X amount of candles back. So, if you are fetching the
rsi on the hourly and you want to know what the
rsi was 5 hours ago, set backtrack=5. The default is
0.
chart parameter accepts one of two values: candles or
heikinashi. candles is the default, but if you set this to
heikinashi, the indicator values will be calculated using Heikin Ashi
candles. Note: Pro & Expert Plans only.
true or false. Defaults to false. By setting to
true the API will return a timestamp with every result (real-time and
backtracked) to which candle the value corresponds. This is especially helpful when
requesting a series of historical values using the results parameter.
1685577600
1731456000 If
you only use fromTimestamp, the API will return all results from that time until
present.
number or max. Use this parameter to access historical
values on the past X candles until the most recent candle. Use max
to return all available historical values. Returns an array with the oldest value on top
and most recent value returned the last.
Adjust the RSI length – the number of candles used to calculate the RSI.
Default: 14
More examples
Let's say you want to know the rsi value on the last closed
candle on the 30m timeframe. You are not interest in the real-time value, so you
use the backtrack=1 optional parameter to go back 1 candle in history to the last
closed candle.
[GET] https://api.taapi.io/rsi?secret=MY_SECRET&exchange=binance&symbol=BTC/USDT&interval=30m&backtrack=1
Get rsi values on each of the past X candles in one call
Let's say you want to know what the rsi daily value was each
day for the previous 10 days. You can get this returned by our API easily and efficiently in one
call using the results=10 parameter:
[GET] https://api.taapi.io/rsi?secret=MY_SECRET&exchange=binance&symbol=BTC/USDT&interval=1d&results=10
Looking for even more integration examples in different languages like NodeJS, PHP, Python, Curl or Ruby? Continue to [GET] REST - Direct documentation.