Supertrend
The Supertrend is a popular indicator (and one of the most popular indicators on our API) used to identify the direction of a trend and potential reversal points. It is based on a combination of price and volatility factors.
The indicator consists of two components: the basic trend and the volatility factor. The basic trend is determined by calculating the average true range (ATR) over a specified period, which reflects market volatility. The volatility factor is then multiplied by a user-defined multiplier, and the result is added to the average true range for an uptrend or subtracted for a downtrend. The resulting value creates a band above and below the price chart, indicating potential support and resistance levels. When the price crosses above the upper band, it suggests a bullish trend, while a cross below the lower band indicates a bearish trend.
Fine-tune the Supertrend via API optional parameters
You can customize the Supertrend indicator by utilizing two optional parameters, namely period and multiplier, enabling you to adjust the indicator according to your trading preferences and market conditions. The period parameter allows you to specify the number of periods used in calculating the average true range (ATR), influencing the responsiveness of Supertrend to recent price changes. Opting for a shorter period enhances reactivity to short-term fluctuations, while a longer period smoothens the indicator, making it more responsive to longer-term trends.

Additionally, the multiplier optional parameter empowers you to fine-tune the impact of volatility on the Supertrend indicator. A higher multiplier increases sensitivity, widening the bands, while a lower multiplier reduces sensitivity, narrowing the bands. By adjusting these optional parameters based on your strategy and the prevailing market dynamics, you can tailor the indicator to align with your trading style, enhancing its effectiveness in identifying trends and potential reversal points.
Supertrend tells you to go long or short
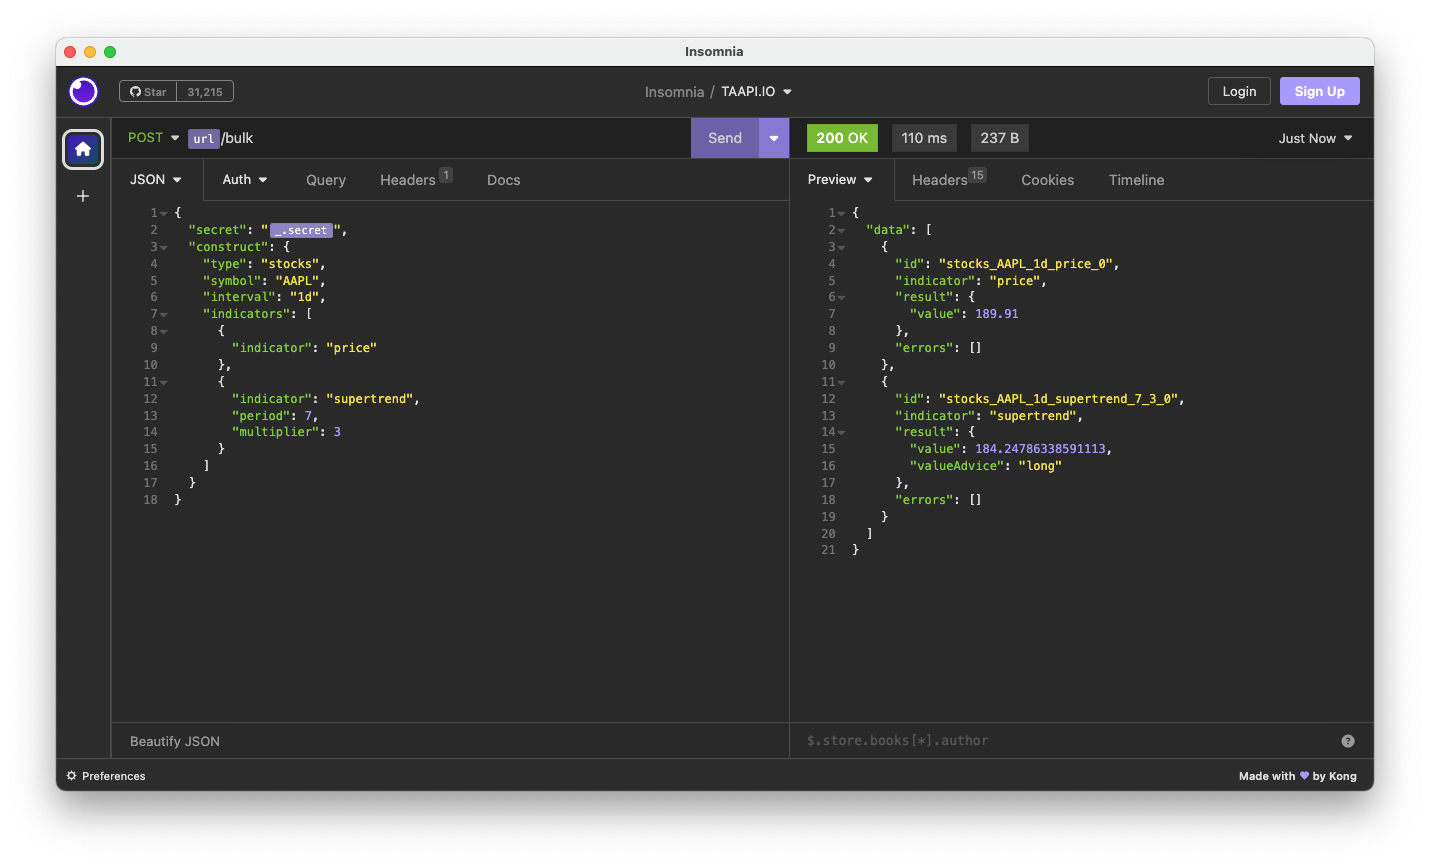
The Supertrend indicator is widely used in various financial strategies, including stocks (we introduced US stocks in September 2023), crypto (try one of the popular exchanges like Binance) or and forex. Traders often use this indicator in conjunction with other indicators to strengthen their overall decision-making process and gain a more comprehensive view of market conditions. Follow the examples below or get started with our full documentation.
Get started for Free
The best way to access Supertrend is with our Pro and Expert plans.
Test drive TAAPI.IO risk-free with our 7-day free trial on all paid plans! We’re confident you’ll be hooked for the long haul!
-
Sale!

Pro
From: €14.99 / month with a 7-day free trialMost popular
Select options- All indicators
- 150.000 calls / day
- US Stocks – real-time and historical
- Indexes (SPY, QQQ, DJIA)
- Crypto data real-time and historical
- 3 symbols per API request
- Historical data 300 candles back using results
- Priority support
7-day Free Trial
-
Sale!

Expert
From: €29.99 / month
Select options- All indicators
- 400.000 calls / day
- US Stocks – real-time and historical
- Indexes (SPY, QQQ, DJIA)
- Crypto data real-time and historical
- 10 symbols per API request
- Historical data 2000 candles back using results
- Priority support
Get started with the supertrend
Simply make an HTTPS [GET] request or call in your browser:
[GET] https://api.taapi.io/supertrend?secret=MY_SECRET&exchange=binance&symbol=BTC/USDT&interval=1h
API response
The supertrend endpoint returns a JSON response like this:
			{
  "value": 37459.26060042173,
  "valueAdvice": "long"
}
Example response from TAAPI.IO when querying supertrend endpoint.
API parameters
binance, binancefutures or one of our supported exchanges. For other crypto / stock exchanges, please refer to our Client or Manual integration methods.
BTC/USDT Bitcoin to Tether, or LTC/BTC Litecoin to Bitcoin...
1m, 5m, 15m, 30m, 1h, 2h, 4h, 12h, 1d, 1w. So if you're interested in values on hourly candles, use interval=1h, for daily values use interval=1d, etc.
backtrack parameter removes candles from the data set and calculates the supertrend value X amount of candles back. So, if you are fetching the supertrend on the hourly and you want to know what the supertrend was 5 hours ago, set backtrack=5. The default is 0.
chart parameter accepts one of two values: candles or heikinashi. candles is the default, but if you set this to heikinashi, the indicator values will be calculated using Heikin Ashi candles. Note: Pro & Expert Plans only.
true or false. Defaults to false. By setting to true the API will return a timestamp with every result (real-time and backtracked) to which candle the value corresponds. This is especially helpful when requesting a series of historical values using the results parameter.
1685577600
1731456000 If you only use fromTimestamp, the API will return all results from that time until present.
true or false. Defaults to true. By setting to false, the API will ensure that there are no candles missing. This often happens on lower timeframes in thin markets. Gaps will be filled by a new candle with 0 volume, and OHLC set the the close price of the latest candle with volume.
number or max. Use this parameter to access historical values on the past X candles until the most recent candle. Use max to return all available historical values. Returns an array with the oldest value on top and most recent value returned the last.
Default: 7
Default: 3
More examples
Let's say you want to know the supertrend value on the last closed candle on the 30m timeframe. You are not interest in the real-time value, so you use the backtrack=1 optional parameter to go back 1 candle in history to the last closed candle.
[GET] https://api.taapi.io/supertrend?secret=MY_SECRET&exchange=binance&symbol=BTC/USDT&interval=30m&backtrack=1
Get supertrend values on each of the past X candles in one call
Let's say you want to know what the supertrend daily value was each day for the previous 10 days. You can get this returned by our API easily and efficiently in one call using the results=10 parameter:
[GET] https://api.taapi.io/supertrend?secret=MY_SECRET&exchange=binance&symbol=BTC/USDT&interval=1d&results=10
Looking for even more integration examples in different languages like NodeJS, PHP, Python, Curl or Ruby? Continue to [GET] REST - Direct documentation.
