Bollinger Bands
The Bollinger Bands is a popular technical indicator used by traders in financial markets to analyze price volatility and potential trend reversals. It consists of three lines plotted on a price chart: the upper band, the middle band, and the lower band. The middle band represents the moving average of the underlying asset’s price over a specified period, typically 20 candles (adjustable using the optional period parameter).
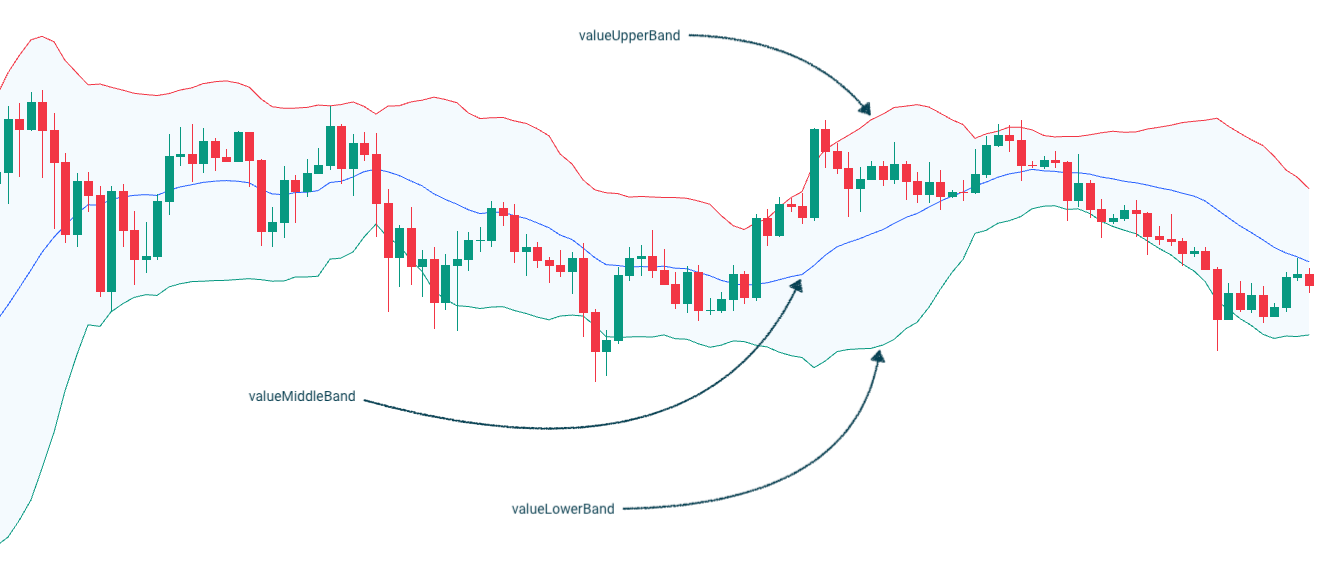
The upper and lower bands are placed a certain number of standard deviations away from the middle band, usually two standard deviations. The result returned in the given format provides the numerical values for the upper band, middle band, and lower band.
Traders can use Bollinger Bands to identify periods of low volatility (when the bands are narrow) and high volatility (when the bands widen). When the price touches or moves beyond the upper band, it suggests that the asset may be overbought, potentially indicating a selling opportunity. Conversely, when the price reaches or falls below the lower band, it suggests oversold conditions, potentially signalling a buying opportunity. Traders often look for price reversals or bounces off the bands to make trading decisions and assess potential price targets and stop-loss levels.
Get started for Free
The best way to access Bollinger Bands is with our Pro and Expert plans.
Test drive TAAPI.IO risk-free with our 7-day free trial on all paid plans! We’re confident you’ll be hooked for the long haul!
-
Sale!

Pro
From: €14.99 / month with a 7-day free trialMost popular
Select options This product has multiple variants. The options may be chosen on the product page- All indicators
- 150.000 calls / day
- US Stocks – real-time and historical
- Indexes (SPY, QQQ, DJIA)
- Crypto data real-time and historical
- 3 symbols per API request
- Historical data 300 candles back using results
- Priority support
7-day Free Trial
-
Sale!

Expert
From: €29.99 / month
Select options This product has multiple variants. The options may be chosen on the product page- All indicators
- 400.000 calls / day
- US Stocks – real-time and historical
- Indexes (SPY, QQQ, DJIA)
- Crypto data real-time and historical
- 10 symbols per API request
- Historical data 2000 candles back using results
- Priority support
Get Bollinger Bands via API
We provide API access to the Bollinger Bands values for all of the most popular assets like stocks, crypto (try one of the popular exchanges like Binance) and forex, on all commonly used timeframes – from the weekly and daily all the way down to one minute intervals. You can also calculate the values on your own data using our manual method.
Get started with the bbands
Simply make an HTTPS [GET] request or call in your browser:
[GET] https://api.taapi.io/bbands?secret=MY_SECRET&exchange=binance&symbol=BTC/USDT&interval=1h
API response
The bbands endpoint returns a JSON response like this:
					{
  "valueUpperBand": 23491.10808422158,
  "valueMiddleBand": 21935.281499999997,
  "valueLowerBand": 20379.454915778413
}
Example response from TAAPI.IO when querying bbands endpoint.
API parameters
binance,
binancefutures or one of our supported exchanges. For other crypto / stock
exchanges, please refer to our Client
or Manual integration methods.
BTC/USDT Bitcoin to Tether, or
LTC/BTC Litecoin to Bitcoin...
1m,
5m, 15m, 30m, 1h, 2h,
4h, 12h, 1d, 1w. So if you're
interested in values on hourly candles, use interval=1h, for daily values
use interval=1d, etc.
backtrack parameter removes candles from the data set and calculates
the bbands value X amount of candles back. So, if you are fetching the
bbands on the hourly and you want to know what the
bbands was 5 hours ago, set backtrack=5. The default is
0.
chart parameter accepts one of two values: candles or
heikinashi. candles is the default, but if you set this to
heikinashi, the indicator values will be calculated using Heikin Ashi
candles. Note: Pro & Expert Plans only.
true or false. Defaults to false. By setting to
true the API will return a timestamp with every result (real-time and
backtracked) to which candle the value corresponds. This is especially helpful when
requesting a series of historical values using the results parameter.
1685577600
1731456000 If
you only use fromTimestamp, the API will return all results from that time until
present.
number or max. Use this parameter to access historical
values on the past X candles until the most recent candle. Use max
to return all available historical values. Returns an array with the oldest value on top
and most recent value returned the last.
The period length (number of candles) to consider in the data set.
Default: 20
Standard deviation value of the price.
Default: 2
More examples
Let's say you want to know the bbands value on the last closed
candle on the 30m timeframe. You are not interest in the real-time value, so you
use the backtrack=1 optional parameter to go back 1 candle in history to the last
closed candle.
[GET] https://api.taapi.io/bbands?secret=MY_SECRET&exchange=binance&symbol=BTC/USDT&interval=30m&backtrack=1
Get bbands values on each of the past X candles in one call
Let's say you want to know what the bbands daily value was each
day for the previous 10 days. You can get this returned by our API easily and efficiently in one
call using the results=10 parameter:
[GET] https://api.taapi.io/bbands?secret=MY_SECRET&exchange=binance&symbol=BTC/USDT&interval=1d&results=10
Looking for even more integration examples in different languages like NodeJS, PHP, Python, Curl or Ruby? Continue to [GET] REST - Direct documentation.